Operate / live debugging
Inspect the system while it’s running.
Something’s stuck. One process’s inbox keeps growing. The same piece keeps crashing and getting restarted. Normally you’d be adding log lines and redeploying to find out why. Goer comes with a small control room so you don’t have to. On this page you’ll start it, learn what each tab is for, and walk through pausing a live process and stepping it one message at a time. If you’d rather have the same data in code, that’s the observability API.
Start the dashboard
Any of these turns it on. It prints its address when it starts; unless you say otherwise that’s 127.0.0.1:8787.
goer debug ./mysystem                       # run with the dashboard
goer run -dash -addr 127.0.0.1:8788 ./mysystem
goer run -trace ./mysystem                  # plus system-wide redacted tracing
goer build -debug ./mysystem -o mysystem    # a binary with the dashboard on by default
Already got a system running? goer dashboard --attach opens a local window onto its dashboard. You have to give it the address. It won’t go looking.
goer dashboard --attach http://127.0.0.1:8787 -addr 127.0.0.1:8788In your own Go program you can put the dashboard on any path you like: http.Handle("/debug/runtime/", sys.DebugHandler()).
The six tabs
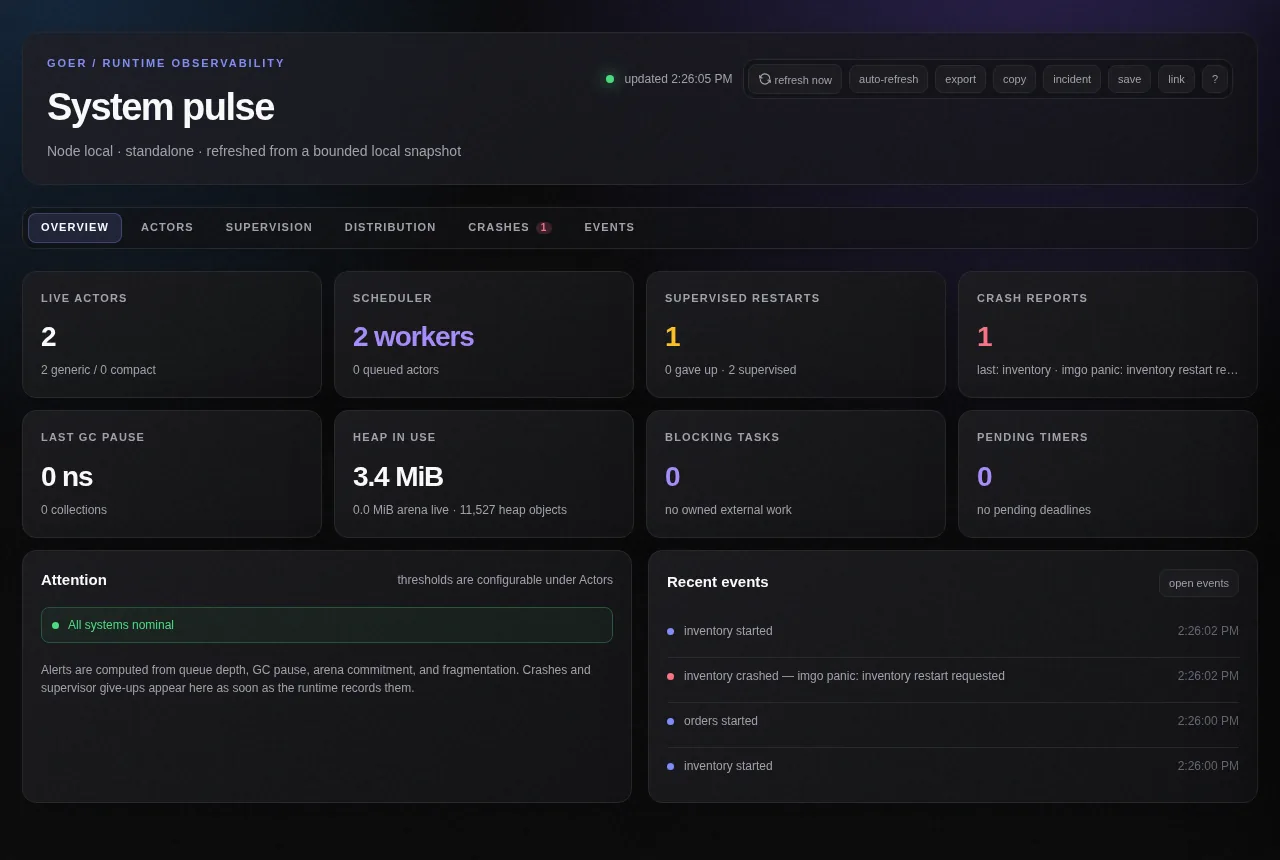
The big numbers: how many processes are alive, how many are waiting for a turn, restarts, crashes, garbage-collector pause, memory, and slow jobs in flight. Underneath, anything that needs your attention and the latest events.
A list of processes with their mailbox size, messages handled, how long the last one took, and what line they’re on. You can search, filter (paused, backed up, native…), and sort.
Every supervised process: who its parent is, its restart rule, how many restarts, whether the supervisor gave up, and why it last stopped.
The other nodes you’re connected to and when you last heard from each. You can pull a sample of their processes too.
The last 32 crashes. Each has the process, the reason, the message it was handling, and the file and line.
A running history: started, stopped, crashed. With tracing on you also get every message, send, and port call. You can filter down to just the problems.
Press 1–6 to switch tabs, / to search, r to refresh, and ? for all the shortcuts. The page refreshes itself every two seconds. There’s a button to freeze it while you read.
Look at one process
Click a process’s name and a panel opens. You’ll see whether it’s running or paused, how much it’s done, how long its oldest message has been waiting, and its restart rule and count. When something’s wrong, two lists usually tell you why:
The messages in its mailbox, grouped by type: PlaceOrder × 40, say, or a pending runtime: code swap. You see names and counts. Never the contents.
For an imgo process that’s paused or waiting in Ask: the function, the message it’s handling, and the file and line.
Native actors don’t have that second list, but they can offer a few facts of their own, which show up under Native diagnostics.
Pause, step, stop
The buttons in that panel are the only things in the dashboard that change anything. Each one affects exactly one process.
| Button | What it does |
|---|---|
| Trace | Writes an event for every message this process handles and sends. Off unless you turn it on. |
| Pause | Stops the process after the message it’s on. New messages keep arriving and wait. Nothing’s lost. |
| Resume | Lets a paused process get back to its mailbox. |
| Step one message | Handles exactly one waiting message, then pauses again so you can look. |
| Step one VM instruction | imgo only. Runs one tiny step of the code and pauses, showing where it is. Use it to walk through a handler slowly. |
| Stop | Asks the process to finish what’s waiting and stop. It won’t be restarted. |
| Kill | Crashes the process right now, with a reason. Its supervisor decides whether it comes back. |
Stop and kill ask you to confirm first. Native actors can be paused, stepped by message, and killed, but there are no instructions to step through.
Try it yourself
The order desk from the tutorials was built to be poked at. Start it and open the dashboard:
goer debug ./examples/orderdesk- Find the process that’s waiting. Within a second, the Actors tab shows
orderson a line likeOrder @51 · orderdesk_actor.go:109. It’s insideAsk, waiting five seconds for a warehouse port that’s slow on purpose. Click it to see what’s queuing up behind. - Read a crash. Two seconds in, inventory panics. A badge appears on Crashes, and the report says
Inventory @17 · handling CrashInventory · orderdesk_actor.go:130. Supervision shows one restart. - Pause it and watch the queue grow. Pause
orders. A newPlaceOrderlands every eight seconds and the count goes up. The code change at four seconds shows up asruntime: code swap, waiting in the same line as everything else. - Step through it. With
orderspaused, press step one VM instruction. You’ll see the first line of the next handler. Keep stepping, or press step one message to finish it off, then resume.
You don’t need a browser for any of this. Everything the dashboard does is a plain web request. Here’s a recording of the same session done with curl: it pauses orders, watches the mailbox fill up, steps one message, and lets it go.
- curl -s 'localhost:8787/snapshot?limit=10' | jq -c '.Actors[] | {ID, Name, MailboxDepth, Paused}'
- {"ID":5,"Name":"inventory","MailboxDepth":0,"Paused":false}
- {"ID":6,"Name":"orders","MailboxDepth":0,"Paused":false}
- curl -s 'localhost:8787/crashes' | jq -c '.[] | {actor, reason}'
- {"actor":"inventory","reason":"imgo panic: inventory restart requested"}
- curl -s -H 'Content-Type: application/json' -d '{"action":"pause","id":6,"kind":"actor"}' localhost:8787/control
- {"ok":true}
- curl -s 'localhost:8787/mailbox?id=6&kind=actor' | jq -c '{MailboxDepth, MailboxTypes}'
- {"MailboxDepth":5,"MailboxTypes":[{"type":"InventoryResult","count":1},{"type":"PlaceOrder","count":2},{"type":"runtime: code swap","count":2}]}
- curl -s -H 'Content-Type: application/json' -d '{"action":"step","id":6,"kind":"actor"}' localhost:8787/control
- {"ok":true}
- curl -s 'localhost:8787/mailbox?id=6&kind=actor' | jq -c '{MailboxDepth, MailboxTypes}'
- {"MailboxDepth":4,"MailboxTypes":[{"type":"InventoryResult","count":1},{"type":"PlaceOrder","count":2},{"type":"runtime: code swap","count":1}]}
- curl -s -H 'Content-Type: application/json' -d '{"action":"resume","id":6,"kind":"actor"}' localhost:8787/control
- {"ok":true}
- curl -s 'localhost:8787/snapshot?limit=10' | jq -c '.Actors[] | {Name, MailboxDepth, Paused}'
- {"Name":"inventory","MailboxDepth":0,"Paused":false}
- {"Name":"orders","MailboxDepth":0,"Paused":false}
Share what you see
The buttons at the top save what you’re looking at. export and copy give you the raw numbers as JSON. incident, save, and link make a short summary with the counts, recent crash reasons, and the last twenty events. It leaves out process data and message contents, so it’s safe to paste into a chat or a ticket.
Keep it safe
Out of the box, three things protect it. It never shows what’s inside a process or a message, so it can’t leak your data. It only takes control requests from its own page, so a random website can’t tell your browser to kill something on 127.0.0.1. And unless you set a token, it only answers connections from the same machine. It checks the actual connection for that, so pointing it at a public address doesn’t open it up.
Need it from another machine? Start your app with GOER_DEBUG_TOKEN set (or call SetDashboardToken), then connect with goer dashboard --attach URL -token T.